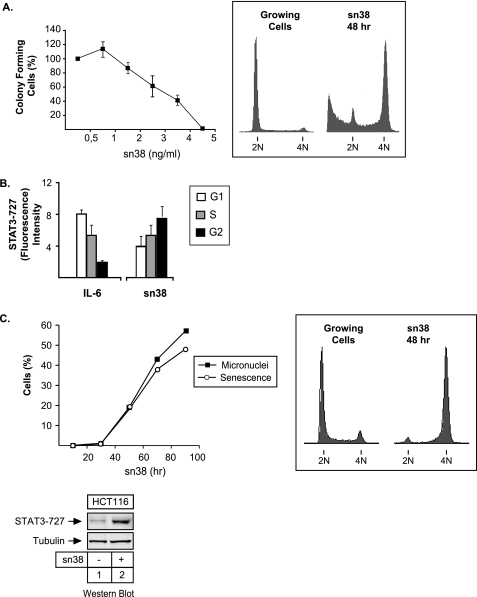
FIGURE 2.
STAT3 is phosphorylated on serine 727 during G2 arrest. A, HT29 cells were treated or not with different concentration of sn38 for 10–14 days. Colony formation was then counted using an inverted microscope, and the growth of non-treated cells was set up at 100%. Clonogenic survival was then plotted as a fraction relative to these untreated cells (n = 5 ± S.D.). In parallel, growing HT29 cells were treated with sn38 (5 ng/ml) for 48 h, and DNA content and apoptosis were then evaluated by flow cytometry (n = 5). B, HT29 cells were treated with sn38 (5 ng/ml) or IL-6 (20 ng/ml) as indicated, and DNA content and serine phosphorylation were then analyzed by flow cytometry analysis using polyclonal antibodies directed against the serine 727-phosphorylated form of STAT3 (n = 3). C, growing HCT116 cells were treated or not with sn38 for different times as indicated. The percentage of senescent cells was evaluated as the number of cells expressing SA-β-gal activity and micronuclei (left part, n = 3). In parallel, DNA content was evaluated by flow cytometry after 48 h (right part), and the phosphorylation of STAT3 on its serine residue was analyzed by Western blot as described above (n = 3, bottom).

