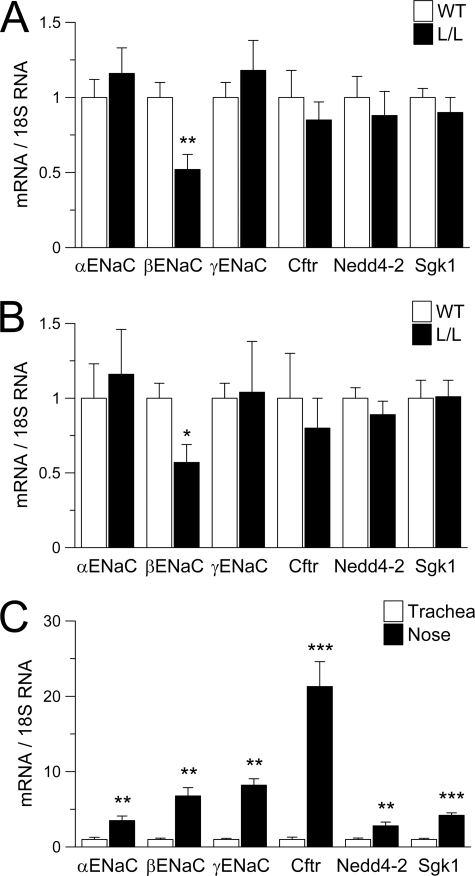
FIGURE 2.
Expression of ENaC subunits and ENaC regulators in nasal and tracheal epithelia. A–C, transcript levels of αENaC, βENaC, γENaC, CFTR, Nedd4-2, and Sgk1 in freshly excised nasal and tracheal tissues from L/L and WT mice. A and B, comparison of transcript expression levels in nasal (A) and tracheal (B) tissues from L/L versus WT mice. Data are expressed as -fold changes from WT. n = 5–6 mice/group; *, p < 0.05; **, p < 0.01. C, comparison of expression levels in tracheal tissues (open bars) versus nasal tissues (closed bars) from WT mice. Data are expressed as -fold changes from tracheal tissues. n = 5–6 mice/group; **, p < 0.01; ***, p < 0.001. Error bars, S.E.

