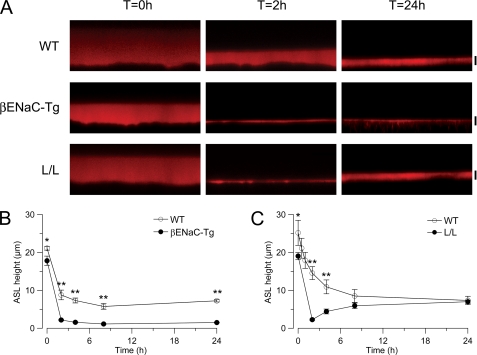
FIGURE 5.
ASL volume regulation in airway epithelia from Liddle mice and βENaC-Tg mice. A–C, Confocal images (A) and summary of measurements of ASL height (B and C) at 0, 2, 4, 8, and 24 h after the mucosal addition of 20 μl of PBS containing Texas Red dextran to primary tracheal epithelial cultures from βENaC-Tg (A and B), L/L mice (A and C), and the respective WT littermates. Scale bars, 7 μm. n = 3–6 mice/group. *, p < 0.05 compared with WT. **, p < 0.01 compared with WT. Error bars, S.E.

