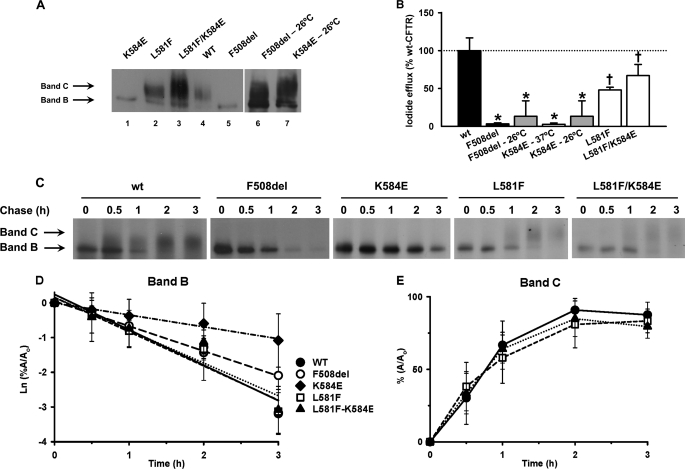
FIGURE 4.
Rescue of trafficking defect of K584E-CFTR by L581F-CFTR. A, biochemical analysis by Western blot of total protein extract from BHK cells stably expressing K584E (lane 1), L581F (lane 2), L581F/K584E (lane 3), WT (lane 4), F508del (lane 5), F508del at 26 °C (lane 6), and K584E at 26 °C (lane 7). The amounts of total protein applied were 40 μg for F508del and K584E at 26 °C and 30 μg for the other CFTR variants. The positions of bands B and C are indicated by arrows. B, magnitude of peak iodide efflux elicited by the indicated CFTR constructs expressed in BHK cells and cultured at either 37 or 26 °C. For each construct, the peak value of iodide efflux stimulated by forskolin (10 μm) and genistein (50 μm) in the time courses shown in supplemental Fig. 3 are expressed as a percentage of that of WT-CFTR. Data are means ± S.E. (n = 6). Asterisks indicate values that are significantly different from WT-CFTR incubated at 37 °C (p < 0.05); crosses indicate significant differences between both CFTR variants incubated at 37 °C (p < 0.05). C, turnover and processing of WT-, F508del-, K584E-, L581F-, and L581F/K584E-CFTR determined in BHK cells stably expressing these CFTR variants by pulse-chase experiments followed by immunoprecipitation. Cells were radiolabeled with [35S]methionine for 20 min and then chased for the indicated times (0, 0.5, 1, 2, and 3 h) before lysis with radioimmunoprecipitation assay buffer and immunoprecipitation with the anti-CFTR antibody M3A7 (Chemicon) (see “Experimental Procedures”). After electrophoresis and fluorography, images were analyzed by densitometry. The positions of bands B and C are indicated by arrows. D, rate of turnover of the immature form of CFTR (band B) shown as the natural logarithm of the amount of band B at a given time of the chase (A) relative to the amount at the beginning of the experiment (Ao). E, efficiency of conversion into mature CFTR (band C) shown as the percentage of band C detected at a given time of the chase (A) relative to the amount at the beginning of the experiment (Ao). In D and E, data are mean ± S.E. (n = 4). In D, the lines are the fit of first-order regressions to the data. Error bars in B, D, and E correspond to S.E.

