FIGURE 1.
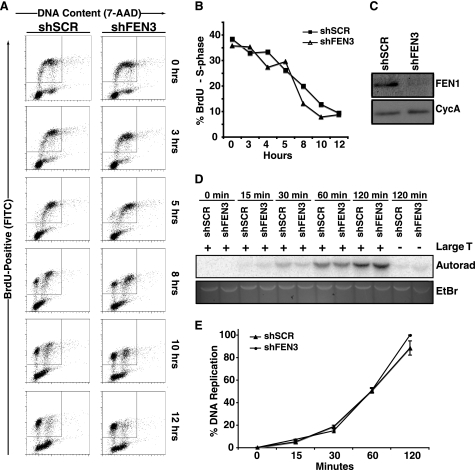
FEN1 depletion does not affect S phase progression or in vitro DNA replication. A, cell cycle progression of HeLa cells expressing shSCR or shFEN3 is shown. HeLa cells were labeled with BrdU for 1 h and analyzed at the indicated times using an anti-BrdU antibody (FITC-conjugated) and 7-amino-actinomysin D (7-AAD) to label DNA content. BrdU-positive cells are displayed on the y axis and represent cells that transit through S phase during BrdU labeling. The x axis displays the DNA content of the cells as indicated by incorporation of 7-amino-actinomycin D (G1 and G2/M cells have a 2 n and 4 n content of DNA, respectively). B, quantification of the percent of BrdU-positive cells in S phase after BrdU pulse (representative experiment is shown) is shown. The cells present in the inset boxes in A are BrdU-positive and consist of cells in G1, S, and G2/M phases of the cell cycle. Only the S phase cells (those that are present between G1 and G2 (2n and 4n DNA content, respectively) within the BrdU-positive population are plotted on the graph. Error bars represent S.E. C, shown are Western blots of S100 lysates from control and FEN1-depleted HeLa cells. Cyclophilin A (CycA, lower panel) is shown as a loading control. D, an SV40 Large T antigen-dependent in vitro DNA replication assay was conducted using lysates from control (shSCR) and FEN1-depleted (shFEN3) HeLa cells as described under “Experimental Procedures.” The assay was stopped at the indicated times, and the replication products were separated via gel electrophoresis. The replication products were detected via autoradiography (Autorad), and the input DNA was observed via ethidium bromide (EtBr) staining. E, shown is quantification of the replication products at the indicated times in D. Two independent experiments were conducted in duplicate, and the average of the four experiments is shown. The error bars represent S.E.

