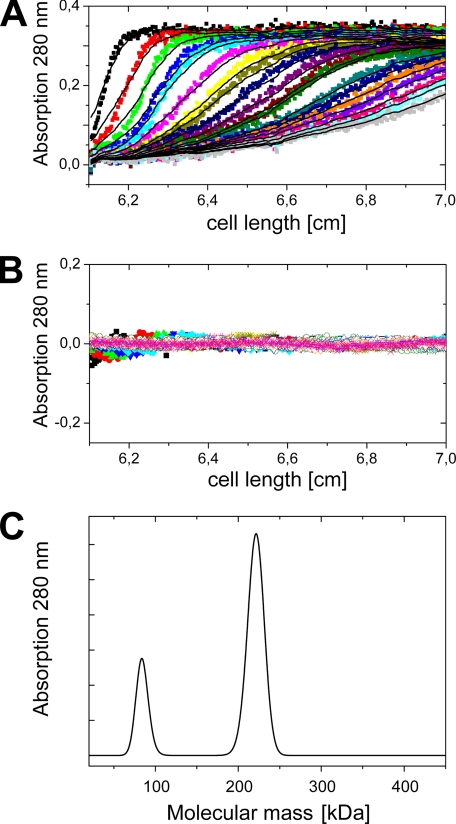
FIGURE 8.
Sedimentation velocity analysis of Na+-NQR. A, sedimentation distributions of Na+-NQR monitored by absorption at 280 nm at different time points are shown as colored dots. The fits of the curves are shown as black lines. B, residuals between experimental data and fits. C, protein molecular mass distribution obtained from the fits in A.

