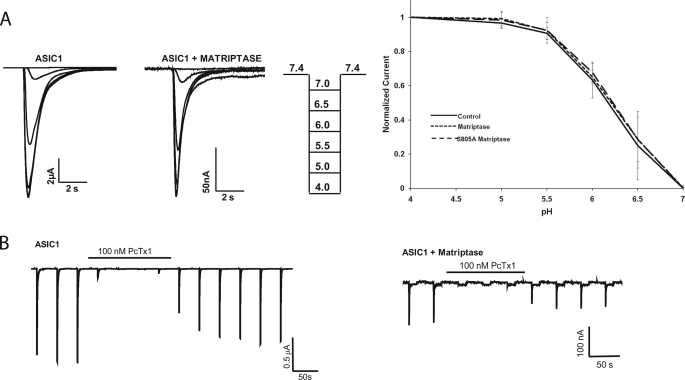
FIGURE 3.
Matriptase does not change the pH activation curve or inhibition by PcTX-1 of ASIC1. A, pH activation curve of currents measured in oocytes injected with 12 ng of ASIC1 alone, ASIC1 plus 8 or 12 ng of matriptase, or ASIC1 plus 12 ng of matriptase S805A. Oocytes were exposed to decreasing activation pH levels from 7 to 4.0. The peak current at each activation pH was normalized to the peak IpH4.0 for each oocyte. Representative pH activation curves and the pH protocol used are shown. The graphed values are means ± S.D. of 10 oocytes (ASIC1), 10 oocytes (ASIC1 + matriptase), and 7 oocytes (ASIC1 + matriptase S805A) from two or three different batches. B, peak IpH4.0 was measured in oocytes expressing ASIC1 alone or ASIC1 with 12 ng of matriptase. 100 nm PcTX-1 in the pH 7.4 solution abolished the IpH4.0 of control ASIC1-injected oocytes as well as of those co-injected with matriptase. Traces shown are representative of three oocytes for ASIC1 and three oocytes for ASIC1 and matriptase.

