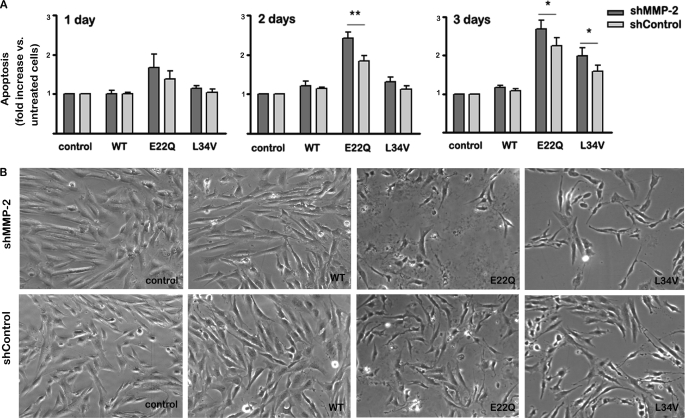
FIGURE 5.
Effect of MMP-2 silencing on Aβ-induced apoptosis in microvascular ECs. Cells were challenged with Aβ-(1–40) peptides (WT, E22Q, and L34V) for 1, 2, and 3 days, and induction of apoptosis was assessed by quantitation of nucleosome formation by Cell Death ELISA together with morphological evaluation by contrast phase microscopy, as described under “Experimental Procedures.” A, apoptosis rate in shMMP-2 and shControl cells is shown. Nucleosome generation values are expressed as -fold increase with respect to untreated control cells. Bars indicate the mean ± S.E. of at least five independent experiments; statistically significant differences with p < 0.01 are indicated by ** and with p < 0.05 by *. B, shown are phase contrast images (400× magnifications) of shMMP-2 and shControl cells after a 3-day treatment with the respective Aβ peptides.

