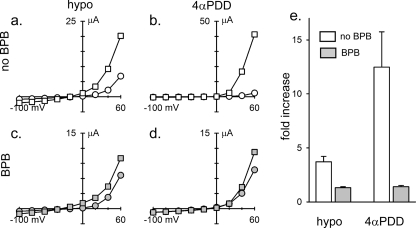
FIGURE 4.
BPB inhibits both the hypotonic and 4α-PDD responses in intact oocytes. Unexposed oocytes (a and b) or those incubated for 5–9 h in 100 μm BPB (c and d) were subjected to 1-s voltage steps of between −100 and 60 mV either before (circles) or after (squares) exposure to hypotonicity (hypo; as described in the legend to Fig. 1) for 10 min (a and c) or to 3 μm 4α-PDD for 20 min (b and d). BPB was present during experimentation as well in c and d. Plotted are peak currents versus test potentials. e shows the relative increase in the peak response at 60 mV in the absence (white bars) or presence (as in c and d; gray bars) of BPB to hypotonicity (left) or 4α-PDD (right) (mean ± S.E., n = 4). Note that the apparent smaller response to hypotonicity in e compared with that shown in Fig. 1b reflects that it was assessed at 60 mV here as opposed to 20 mV in Fig. 1b, and hypotonicity appears to cause a slight leftward shift in the G-V relationship, as can be seen in a.

