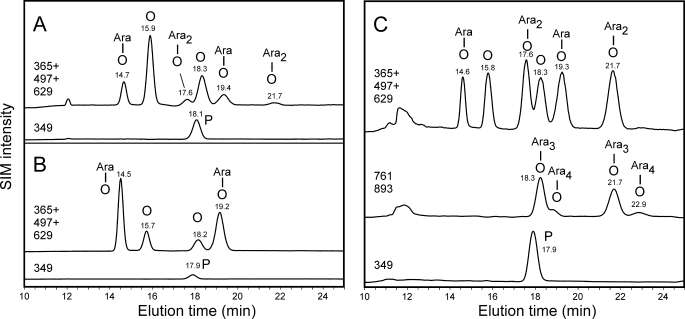
FIGURE 5.
LC-ESI-MS analysis of dansylated glycopeptides. The results for Amb a 4 (A), Art v 1 (B), and gum arabic (C) are shown. The chromatograms of each sample are depicted as two or three SIM traces from the same run to allow presentation of overlapping peaks. SIM traces truly reflect the relative signal intensities. Hyp (shown by the letter O) and its glycopeptides give two peaks according to its trans and allo-d form (31).

