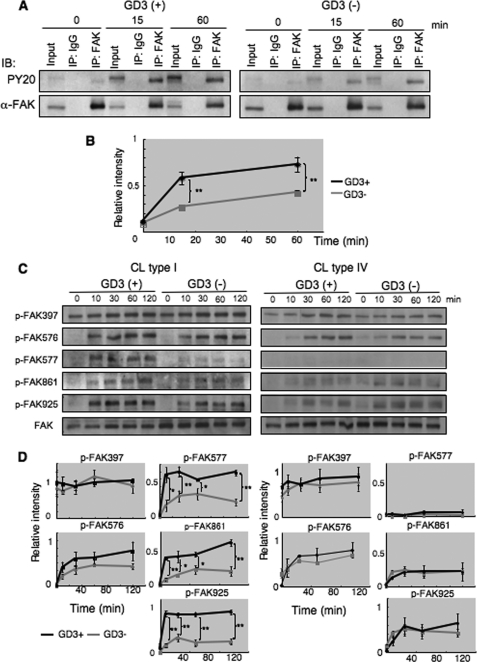
FIGURE 3.
Phosphorylation of FAK during adhesion. A, tyrosine phosphorylation of FAK during adhesion was examined with immunoprecipitation and immunoblotting. GD3+ (G5) or control cells (V4) were detached with 0.02% EDTA in PBS after culturing in serum-free conditions at 37 °C for 14–16 h, and were rotated for 1 h at 37 °C to cancel adhesion signals. Cell suspensions (4 × 10⁵ cells) were added to pre-coated plates with CL type I, and incubated for 0, 15, and 60 min. After incubation, cells were lysed and lysates were used for immunoprecipitation as described under “Experimental Procedures.” Immunoprecipitates were served for immunoblotting using antibodies reactive to FAK or anti-phosphotyrosine antibody PY20. B, bands in A were scanned and the results presented after correction with total FAK bands. Relative phosphorylation levels of FAK in GD3+ cells are shown as black lines, and those of control cells are shown as gray lines. C and D, phosphorylation levels of FAK at individual phosphorylation sites during adhesion to ECM. C, GD3+ (G5) or control cells (V4) were detached after culturing in serum-free conditions at 37 °C for 14–16 h, and rotated for 1 h at 37 °C to cancel adhering signals. Cell suspensions (4 × 10⁵ cells) were added to pre-coated plates with CL type I or CL type IV, and incubated for 0, 10, 30, 60, or 120 min. After incubation, cells were lysed and used (6 μg total proteins) for immunoblotting using antibodies specifically reactive to the individual phosphorylation sites of FAK. Bands in autofluorograms (C) were quantified by a scanner, and the relative intensities of the bands were plotted after correction with total FAK bands (D). Bars indicate mean ± S.D. (n = 3). *, p < 0.05; **, p < 0.01.

