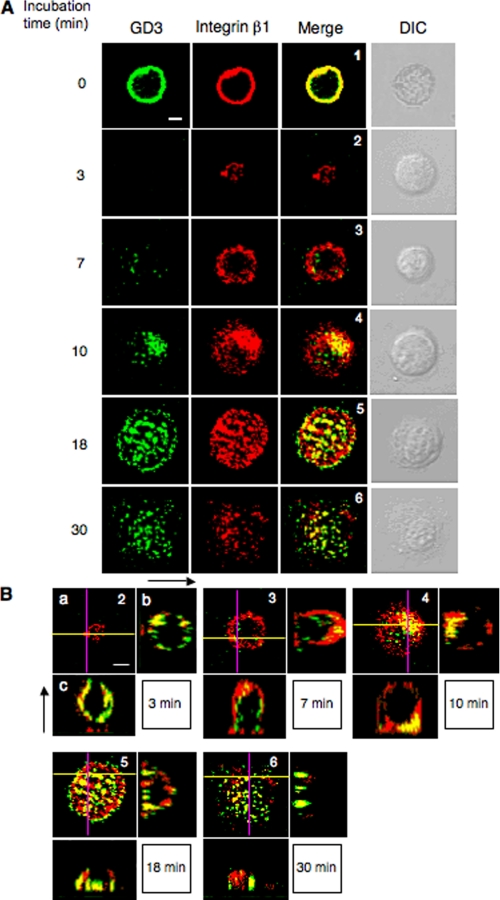
FIGURE 7.
Spatio-temporal relationships between integrins and GD3 during adhesion. A, cells (G5) were plated on pre-coated plates with CL type I after being treated and rotated under serum-free conditions as described in the legend to Fig. 3. After incubation for 0, 3, 7, 10, 18, and 30 min, cells were fixed with 4% paraformaldehyde and treated with 0.1% Triton X-100 in PBS. Then cells were stained for integrin β1 (red) and GD3 (green), and their images were observed using a confocal microscope. It was confirmed that there is no cross-reaction between the authentic antigens and non-relevant second reagents. DIC indicates images of differential interference contrast microscope. B, a, similar images as shown in A. The numbers in the images correspond to the numbers in A. b, images of the y-z axis in a (purple line). The left side in the image is the adhesion site. c, images of the x-z axis in a (yellow line). The bottom side in the image is the adhesion site. Scale bars indicate 10 μm.

