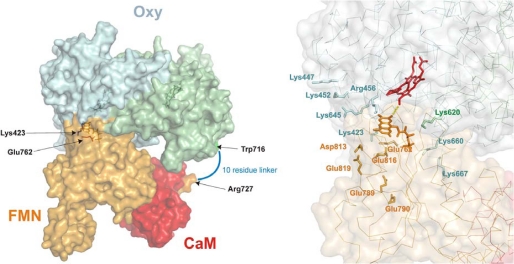
FIGURE 7.
Docking model of a nNOSoxy-FMN-CaM complex. Left, molecular surface of the complex. nNOSoxy monomers are shown in light blue and light green; the FMN domain is shown in light orange, and CaM is shown in red. The residues Trp716 and Arg727, which are linked by a 10-residue sequence are shown in green and orange, respectively; residues Lys423 and Glu762 are shown in blue and red, respectively. Right, location of selected residues in the model. α carbon traces are shown as thin lines. Residues mutated in this study and in Panda et al. (20) are shown as sticks. Oxy domain residues are labeled in blue/green (monomer A/B); FMN domain residues are labeled in orange. Heme (red) and FMN (orange) are shown as sticks.

