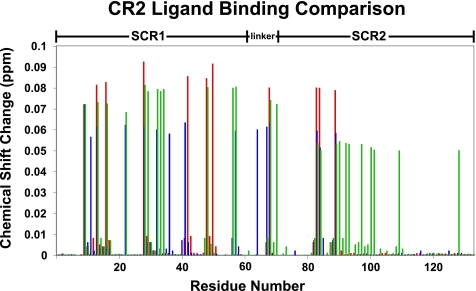
FIGURE 3.
NMR-derived CR2-ligand binding residue comparison. Histogram illustrates chemical shift changes induced in the backbone amides of CR2 SCR1–2 upon binding C3d, IFNα, or gp350. Residues affected by C3d ligation are illustrated in green. Residues affected by IFNα ligation are illustrated in blue. Residues affected by gp350 ligation are illustrated in red.

