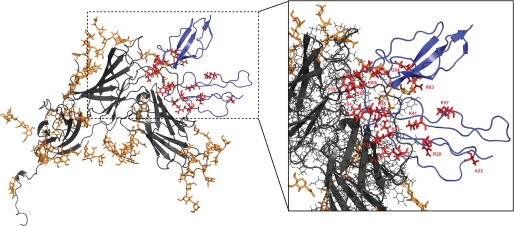
FIGURE 5.
HADDOCK CR2-gp350 docking model with NMR-derived CR2-gp350 ligand binding residues highlighted. Model is from Young et al. (43). Gray ribbons represent gp350, and orange represents glycosyl groups that decorate the surface of gp350. Blue ribbons represent CR2 SCR1–2 with NMR-derived CR2-gp350 ligand-binding residues in red. Inset, magnified view of theoretical side chain interactions between NMR-derived binding residues and gp350 mapped on the docking model of Young et al. (43).

