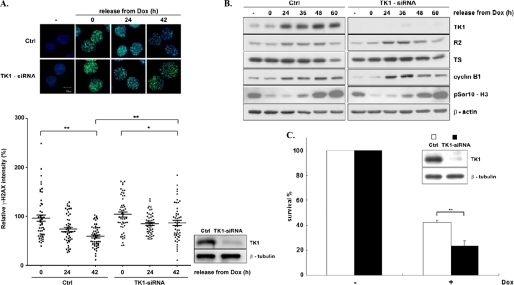
FIGURE 5.
The contribution of TK1 to the DNA repair efficiency during recovery from DNA damage. A, HCT-116 p53−/− cells plated on the coverslip were transfected with 100 pmol of control and TK1-siRNA. After 48 h cells were treated with Dox and released as described previously. At the indicated times cells were stained with anti-γ-H2AX/FITC and Hoechst 33342 for immunofluorescence microscope observations. The immunofluorescence intensity of γ-H2AX staining was quantified by the ImageJ software (n = 50). The mean value of γ-H2AX immunofluorescence staining in control cells with Dox pulse-treatment for 4 h was set to 100%. The graph shown in the right panel represents relative intensity of γ-H2AX staining in nuclei. p < 0.05 (*) and p < 0.01 5 (**) is based on Student's t test. Ctrl, control. B, total proteins were harvested at the indicated times during recovery from DNA damage and analyzed by Western blotting. C, cells after siRNA transfection for 6 h were trypsinized and re-plated onto a 96-well-plate at 2.5 × 10³ cells per well. These cells were allowed to grow additionally for 48 h before 5 μm Dox treatment and released as described previously. After 48 h, cell survival was measured by MTS assay; data are the mean ± S.D. from three independent experiments. **, p < 0.01 relative to control samples based on a Student's t test.

