FIGURE 2.
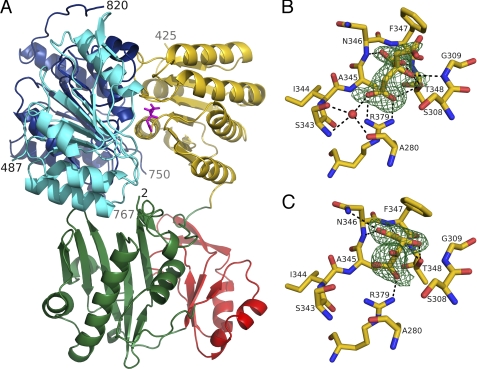
Truncated human ATP-citrate lyase. A, in complex with citrate. The protein is shown as a ribbon diagram, while citrate is shown as a stick model in magenta. Residues 2–31 and 108–243 form domain 4, which is colored green. Domain 3 includes residues 32–107 and is red. Domain 5 includes residues 244–425 and is yellow. Domain 1 includes residues 487–624 and is cyan. Domain 2 includes residues 625–820 and is blue. The terminal residues seen in the electron density are labeled with their residue numbers. The ATP-grasp fold, formed by domains 3 and 4, is at the bottom of the diagram, and ATP/ADP would be expected to bind to the back, as oriented here. B, electron density for citrate bound to the selenomethionyl protein. C, electron density for tartrate bound to human ATP-citrate lyase. Citrate or tartrate and the nearby residues are shown as stick models, colored according to atom type: red for oxygen, blue for nitrogen, and yellow for carbon. Hydrogen bonds are shown as black dashed lines. The electron density, shaded green and contoured at 3σ, is from an Fo − Fc omit map calculated using PHENIX (38) after omitting either citrate or tartrate from the refinement. This figure and Figs. 5 and 6 were drawn using PyMOL (62).

