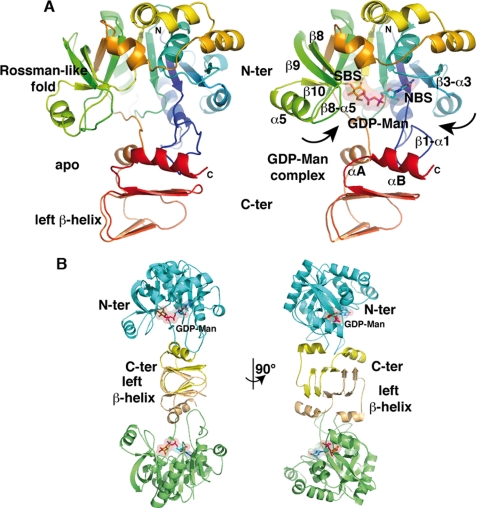
FIGURE 1.
Overall view of a TmGMP subunit and the TmGMP dimer. A, ribbon diagrams of a TmGMP monomer in the apo (left panel) and GDP-Man-bound (right panel) forms viewed down the active site and colored as a rainbow gradient from blue (N-terminal) to red (C-terminal). The nucleotide-binding (NBS) and sugar-binding (SBS) sites are indicated. B, the TmGMP dimer, viewed in two orientations rotated by 90°, is shown with the N- and C-terminal domains colored green/blue and orange/yellow, respectively, for each of the two domains within a subunit. GDP-Man is bound at each active site and is shown through a transparent surface. The GDP-Man is shown with orange carbon, red oxygen, blue nitrogen, and magenta phosphorus atoms.

