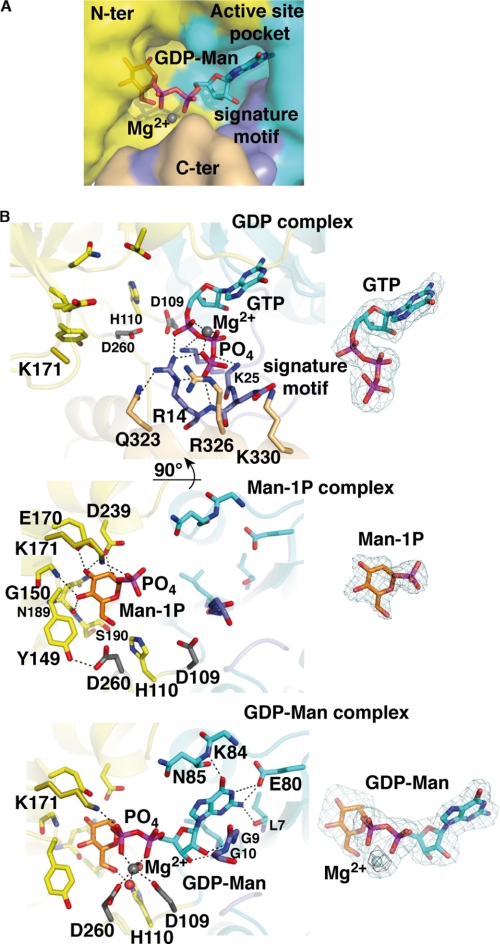
FIGURE 2.
Active site region of TmGMP with bound substrates and product. A, molecular surface of TmGMP, oriented as in Fig. 1, surrounding the active site region with bound GDP-Man and Mg2+ ion (gray sphere) colored as in Fig. 1. The signature motif is shown in purple. B, close-up views of TmGMP with bound GTP, Man1P, and GDP-Man (left panel, top to bottom). The side chains in the nucleotide-binding site and signature motif are shown in cyan and purple, those in the sugar-binding site are in yellow, and those in the C-terminal domain are in orange. The two Asp side chains that coordinate Mg2+ are shown in gray, and the water molecules are red spheres. The corresponding Fo − Fc omit electron density maps (right panel, top to bottom) are contoured at 3.0 σ (cyan) and 5.0 (black).

