FIGURE 4.
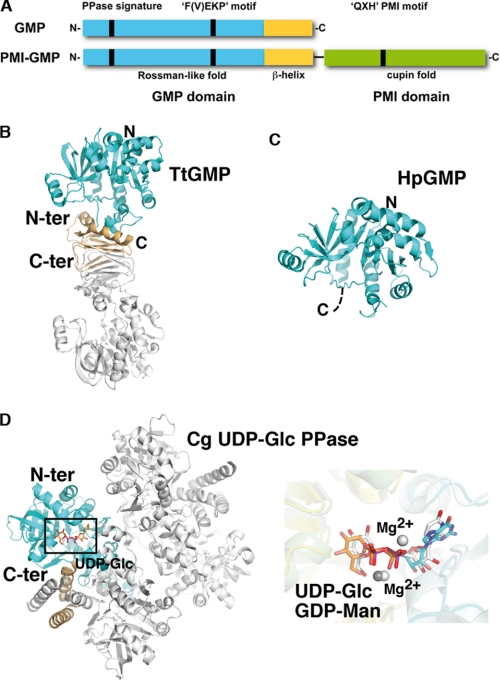
Structural comparison. A, schematic diagram of the molecular organization of monofunctional GMP versus bifunctional GMP/PMI. The positions of the three signature motifs are indicated as vertical bars. B–D, ribbon diagrams of TtGMP (B), the GMP domain of bifunctional PMI-GMP from H. pylori (HpGMP) (C), and UDP-Glc PPase from C. glutamicum, oriented as in Fig. 1 (D, left panel). The GMP domain is colored as in Fig. 2. Close-up overlay (right panel in D) of the active site regions of TmGMP and UDP-Glc PPase with bound ligands. GDP-Man is shown with cyan and orange carbon for the nucleotide and sugar moieties, respectively. UDP-Glc is shown with white carbon. Conservation of the active site topology and near perfect overlap of bound GDP-Man, UDP-Glc, and Mg2+ are evident. C-ter, C-terminal; N-ter, N-terminal.

