
Figure 1.
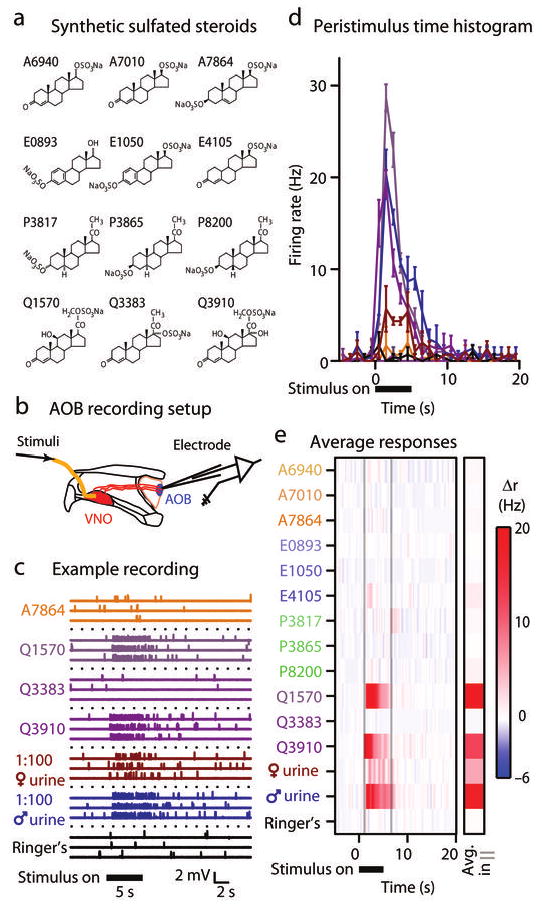
AOB cells respond strongly to sulfated steroids. (a) Structures of the 12 synthetic sulfated steroids used in our study, identified by their catalog number. (b) Ex vivo recording preparation. We isolated and maintained one hemisphere of the mouse skull containing the intact, connected VNO and AOB in a tissue chamber at 33-35° C. We made extracellular recordings from the AOB while delivering stimuli to the VNO. (c) Example extracellular voltage recording from a single cell in response to 4 of the 12 synthetic sulfated steroids used in the study (all at 10 μM), 1:100 dilute BALB/c female and male urine, and control Ringer's saline solutions. Responses to 3 presentations are shown for these stimuli. Upward ticks correspond to single action potentials. (d) Peristimulus time histogram from the same neuron. Solid horizontal bar shows time of stimulus delivery to the VNO. Error bars represent standard error of the mean across trials (6 trials per stimulus). (e) Colorized plot of the change in firing rate (Δr) during stimulus trials. The single column marked “Avg in | |” indicates the average change in firing rate inside the window between the faint vertical lines. This cell responded strongly to BALB/c male urine and two sulfated glucocorticoids (Q1570: corticosterone 21-sulfate; Q3910: hydrocortisone 21-sulfate) that differ in their structure only by a hydroxyl group at carbon 17.