
Figure 2.
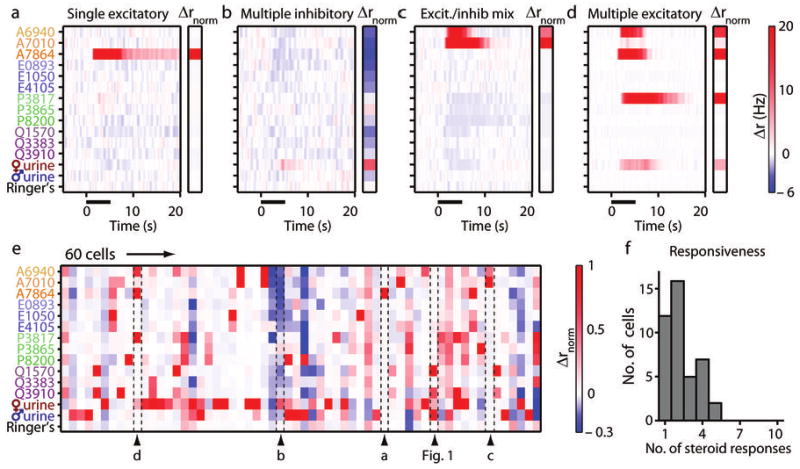
AOB cell population responses to synthetic sulfated steroids. (a-d) Colorized average Δr responses from 4 example AOB neurons. Stimulus presentation is marked by solid black bar. Insets to the right of each plot indicate the normalized Δr response (Δrnorm) of the neuron for each stimulus. The color scale for Δrnorm is shown to the right of panel e. (a) A cell that responded to a single sulfated androgen, A7864 (5-androsten-3β, 17β-diol disulfate). (b) A cell inhibited by several sulfated steroids with little excitatory input. (c) A cell strongly activated by A6940 (epitestosterone sulfate) and A7010 (testosterone sulfate), and broadly inhibited by other steroids and BALB/c female urine. (d) A cell that responded to the same compound as the cell in panel a, another 19-carbon sulfated steroid (A6940), and a 21-carbon sulfated steroid (P3817: allopregnanolone sulfate). (e) Δrnorm during the window from 1 to 6 seconds post-stimulus for the 60 responsive AOB neurons in this study. Labeled arrowheads indicate the position in the array of the cells shown in panels a-d and Figure 1. (f) Histogram of the total number of significant responses to sulfated steroids per cell (42 steroid-responsive AOB neurons total).