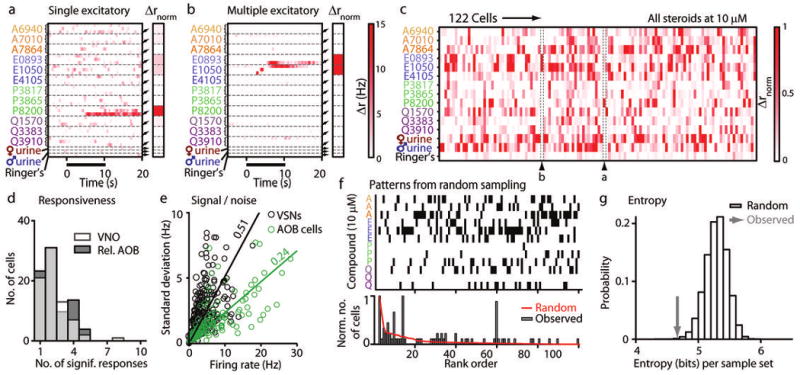
Figure 3.

VSN population responses to synthetic sulfated steroids. (a-b) Colorized average Δr responses from 2 example VSNs to 3 concentrations of each steroid (100 nM, 1 μM, and 10 μM, from top to bottom within each dashed boundary). Stimulus presentation is marked by solid black bar. Insets indicate the Δrnorm response of the neuron to 10 μM steroids, male and female urine, and Ringer's control solution. (a) A cell that responded only to the sulfated pregnanolone, P8200. (b) A cell that responded to E0893 and E1050. (c) Colorized, Δrnorm for 122 responsive VSNs. Labeled arrowheads indicate the position in the array of the cells shown in panels a and b. (d) Histogram of the total number of significant responses to individual sulfated steroids at 10 μM per VSN (transparent white bars in foreground). The relative responsiveness histogram for AOB neurons from Figure 2f is re-plotted in gray in the background. (e) Plot of the response amplitude (abscissa) versus the standard deviation of that response across trials (ordinate) of all statistically significant VSN and AOB responses to stimulation (black and green circles, respectively). Solid lines indicate linear regression lines (VSN slope: 0.51; AOB slope: 0.24). (f) Comparison of observed binary response patterns with expectations from random sampling. Top: the most frequently expected binary response patterns in VSNs expected from random sampling (sorted by rank). Bottom: distribution of occurrences of each pattern above for simulated data (red trace) and observed data (filled gray bars). (g) Entropy of simulated (open bars) and observed data (gray arrow). The probability of encountering a data set with such a low entropy value is less than 10−3 by random sampling.
