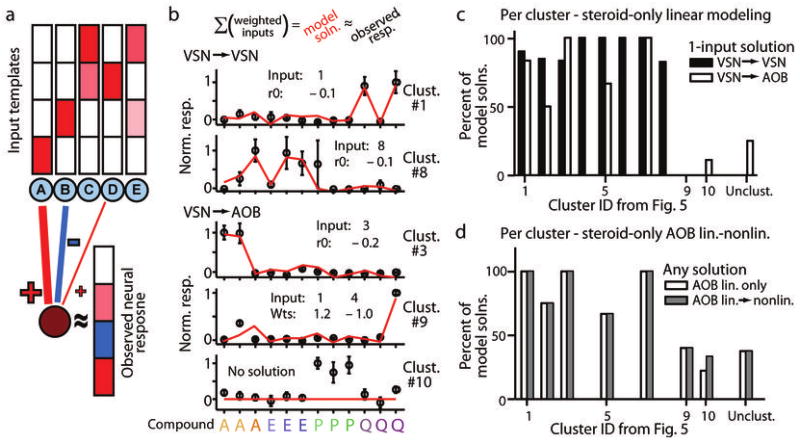
Figure 5.

A linear integration model indicates most AOB neurons receive functional input from a single defined processing stream. (a) Model schematic. We supplied VSN cluster means as potential inputs to AOB cells. Hypothetical responses to 4 single molecules are shown above each hypothetical input template (blue circles labeled A-E). The maroon circle at the bottom represents a hypothetical observed AOB cell, and its response to all 4 single molecules is displayed to the right. We modeled AOB cell responses by adding one weighted template at a time until a fit reached our statistical criterion. Red hues indicate positive changes in firing rate, or an excitatory coupling, and blue hues indicate negative changes in firing rate, or an inhibitory coupling. (b) Examples of linear model solutions for two VSNs and three AOB cells. Open circles designate mean observed responses; error bars represent standard errors of the mean. The red line indicates the linear model solution with the fewest linear inputs. “Input” refers to the identity of the VSN input types (by cluster ID in Fig. 4a). “r0” refers to the linear offset. “Wts” refers to the linear weights assigned to respective inputs. (c) Percentage of linear modeling attempts for VSNs (filled bars) and AOB cells (open bars) that satisfactorily fit observed responses using a single template. Model performance is grouped by cluster number from Figure 4. (d) Percentage of linear and linear-nonlinear model attempts (open and gray bars, respectively) that successfully accounted for AOB response patterns with any number of inputs.
