
Figure 7.
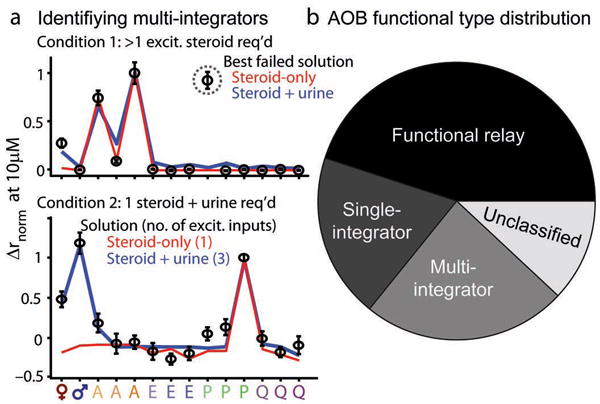
Summary of observed response patterns in AOB neurons. (a) Identification of “multi-integrator” AOB neurons receiving excitatory inputs from two or more processing streams. (top) Best unsuccessful linear-nonlinear model fitting for steroid-only (red trace) and steroid-plus-urine (blue trace) data. Open black symbols indicate the observed normalized firing rates; error bars represent standard errors of the mean. Neither attempt was able to account for the large excitatory response to P3817 (dotted gray circle). (bottom) Linear-nonlinear solutions for a cell identified as a “single integrator” by steroid-only fits (red trace) and as a “multi-integrator” when urine responses were included (blue trace). (b) Proportion of AOB neurons falling into four categories based on linear-nonlinear model results. “Unclassified” cells did not meet the criteria for classification in the three main categories.