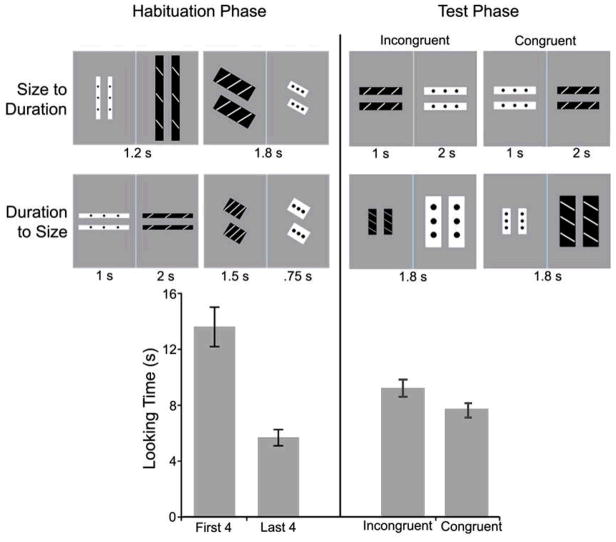
Figure 3.
Space & Time condition in Experiment 2. Examples of stimuli for habituation and test phases for both groups (top panels). Mean looking time (seconds) is reported for habituation and test (bottom panel); error bars represent standard errors. Results are collapsed across group (size-to-duration and duration-to-size), as statistical analyses revealed no significant differences related to group (see Main text).

