FIGURE 5.

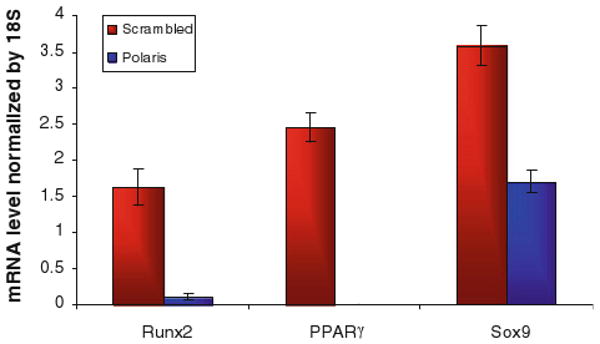
mRNA levels in MSC cells with or without primary cilia after differentiation. The relative gene expression levels were quantified by real time RT-PCR and normalized to 18s rRNA levels. Bars represent mean ± SEM (N ≥ 8 for all groups).

mRNA levels in MSC cells with or without primary cilia after differentiation. The relative gene expression levels were quantified by real time RT-PCR and normalized to 18s rRNA levels. Bars represent mean ± SEM (N ≥ 8 for all groups).