
Figure 2.
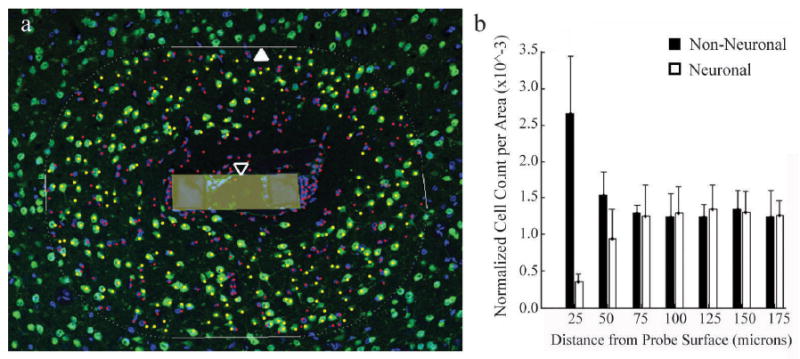
Neuronal (NeuN+ in green, Hoechst+ in blue) and non-neuronal (NeuN-, Hoechst+) nuclei counted by a blinded observer (a), and the resulting output (b). The counting boundary (closed arrow) was calculated based on the user-defined probe surface boundary (open arrow, shaded area), and a blinded observer manually selected neuronal and non-neuronal nuclei within this region (shown in yellow and red, respectively). The location of each nucleus relative to the probe surface was counted, binned in 25 micron increments, and normalized to area.