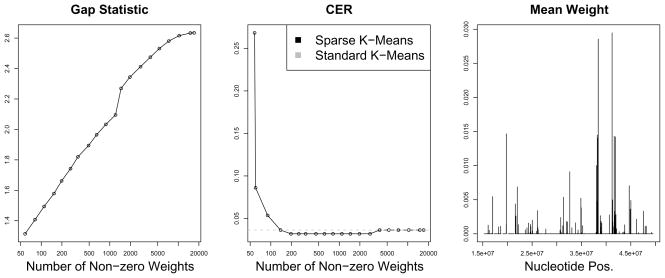
Figure 9.
Left: The gap statistics obtained as a function of the number of SNPs with non-zero weights. Center: The CERs obtained using sparse and standard 3-means clustering, for a range of values of the tuning parameter. Right: Sparse clustering was performed using the tuning parameter that yields 198 non-zero SNPs (this is the smallest number of SNPs that resulted in minimal CER in the center panel). Chromosome 22 was split into 500 segments of equal length. The average weights of the SNPs in each segment are shown, as a function of the nucleotide position of the segments.

