
Fig. 4.
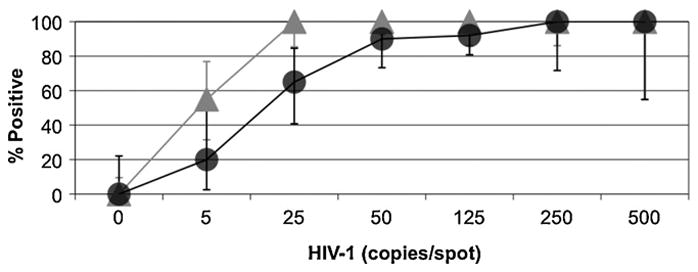
Comparison of HIV-1 spiked 1:10 diluted whole blood and dried blood spots. Error bars represent the 95% confidence interval around each data point. For spiked whole blood ( ), n = 5 for 500 copies/spot, 20 for 250 and 125 copies/spot, 40 for 50 copies/spot, 19 for 25 copies/spot, 20 for 5 copies/spot and 30 for 0 copies/spot. For dried blood spots (●), n = 5 for 500 copies/spot, 9 for 250 copies/spot, 50 for 125 copies/spot, 35 for 50 copies/spot, 20 for 25 copies/spot, 10 for 5 copies/spot and 12 for 0 copies/spot.