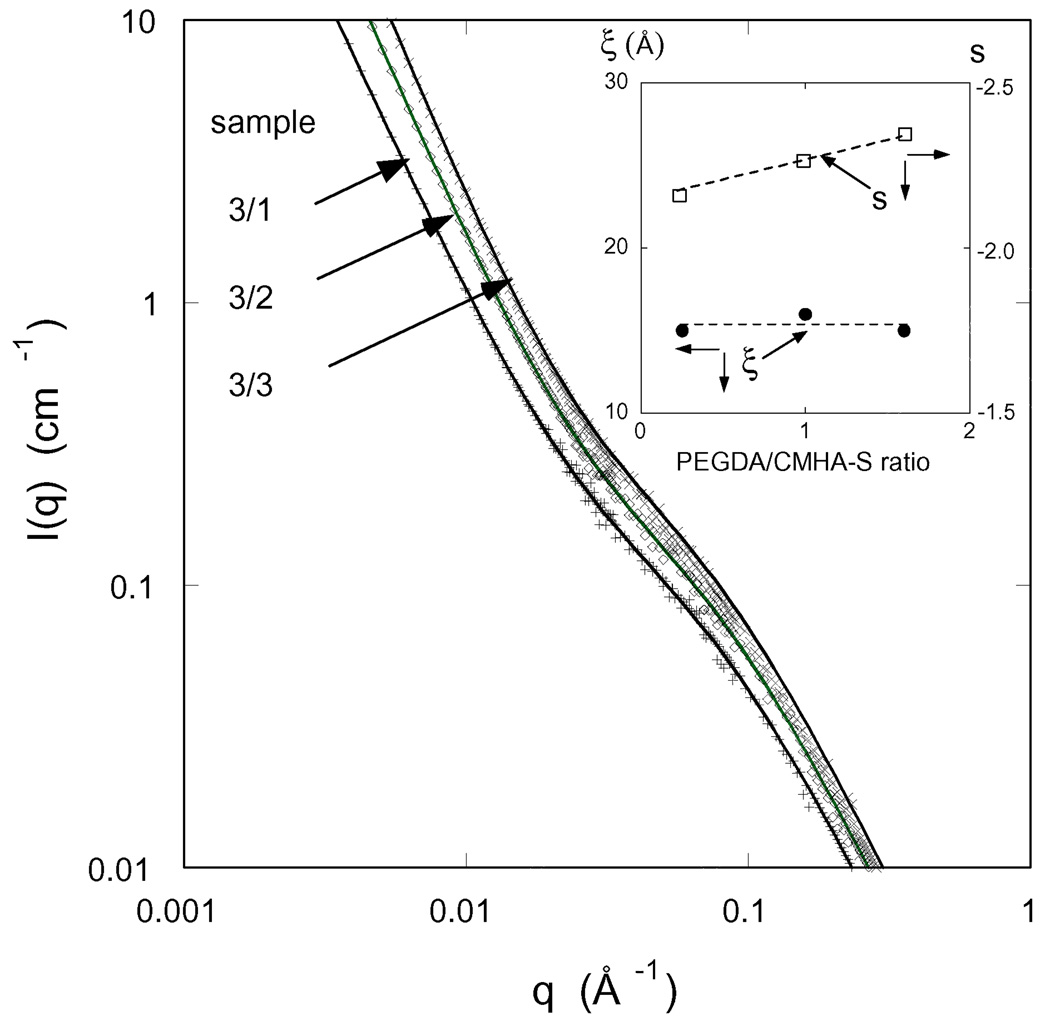
Figure 9.
SANS spectra for three hydrogels with differing crosslinker mole ratio measured at total polymer concentration 0.044 (w/w). The designation of each hydrogel, as defined in Table 1, is given in the legend. Inset shows the variation of the correlation length ξ and the exponent s with crosslinker mole ratio.

