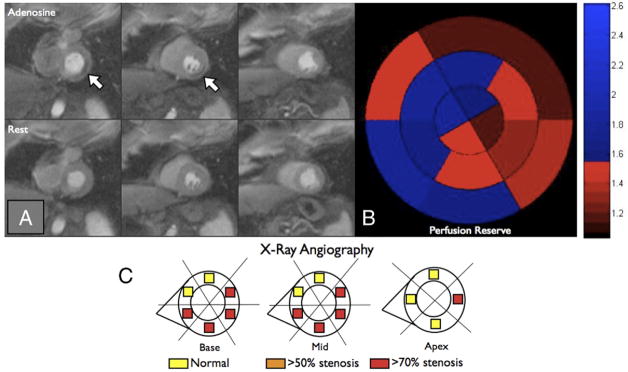
Figure 6. Comparison of Qualitative Interpretation and Perfusion Reserve Analysis, Example 2.
(A) First-pass perfusion images obtained during peak contrast enhancement of the basal left ventricular slice (left column), the mid-ventricular slice (middle column), and the apical slice (right column) are shown during hyperemic (top row) and resting (bottom row) conditions. The white arrows point to a small perfusion defect in the inferolateral wall. (B) Perfusion reserve for each of the 16 segments is plotted using a bulls-eye graph with the color scale shown on the right. Fifty-six percent of the left ventricle had a perfusion reserve <1.55. (C) Based on quantitative coronary angiography, each of the 16 segments was determined to be supplied by a stenosis <50% (yellow), >50% (orange), or >70% (red). Qualitative interpretation significantly underestimated the ischemic burden in this patient with multivessel coronary artery disease.

