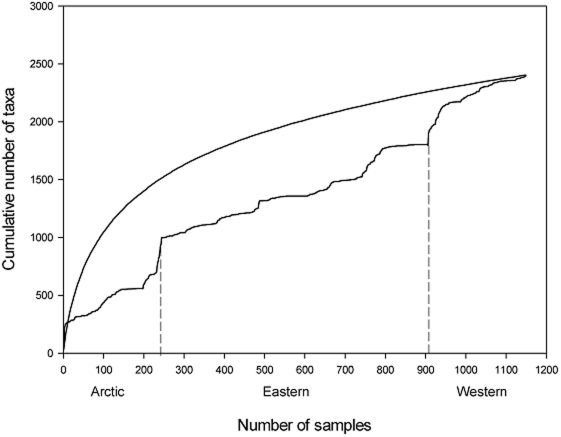
Figure 4. Plot of taxa accumulation curves of infauna for the three Canadian ocean provinces.
The top curve represents the rarefaction curve for the combined three provinces and the lower curve represents samples accumulated in stations within each ocean province (Canadian Arctic, Eastern Canada, and Western Canada).

