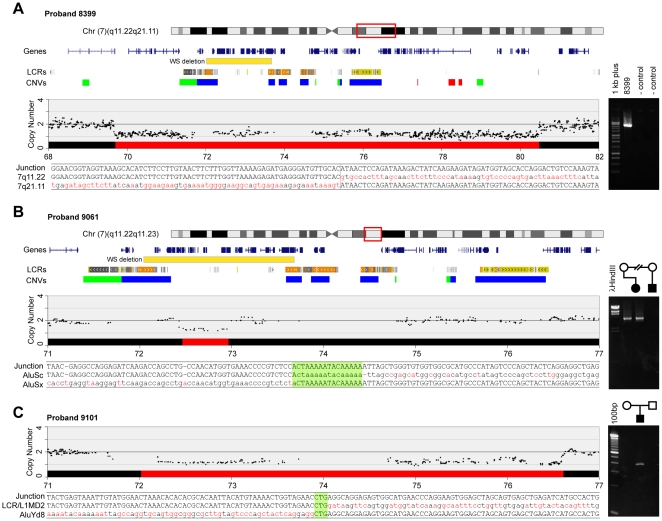
Figure 1. Breakpoint identification in individuals with deletions in the WS region and atypical phenotypes.
Chromosome 7 ideograms showing the region of interest, including the typical WS deletion (yellow boxes) relevant to rearrangements in probands 8399, 9061, and 9101. The LCR and CNV tracks show the location of these features. The copy number track for each individual shows the copy number data from the arrays (black dots), analyzed as described in Methods. The red box on the ideogram represents the extent of the deletion. The sequence tracks show the sequence of the junction fragment aligned with the same region from the non-deleted chromosome. The sequence highlighted in green for probands 9061 and 9101 is present at both breakpoints so the actual break cannot be known. The gel images to the right show the validation of the junctions by PCR amplification of the junction fragment from genomic DNA. (A). Proband 8399 has a 10.8 Mb deletion that includes the entire WS typical region and includes 91 genes. The parents of 8399 were lost to follow up but the junction fragment was absent from two control samples. (B) Proband 9061 has a deletion of 503 kb affecting 13 genes, which includes only part of the WS critical region. The gel image to the right shows the junction fragment was inherited from her mother and was absent from an unaffected relative. (C) Proband 9101 has a 4.4 Mb deletion affecting 71 genes including the entire WS critical region. Chromosome ideogram is the same as that for 9061. The gel image shows this was a de novo deletion in the proband because the junction fragment was absent in both parents. A detailed list of affected genes in these three probands is provided in Figure S2.

