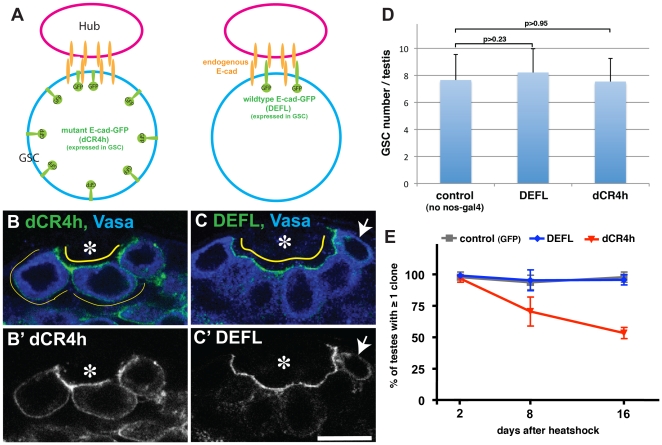
Figure 1. E-caddCR4h does not properly localize to the hub-GSC interface.
(A) Experimental scheme. Wild type E-cadDEFL or dominant-negative E-caddCR4h was expressed in GSCs using the germline-specific driver, nos-gal4. (B) E-caddCR4h was distributed throughout the entire GSC cortex, with a preference for the hub-GSC interface. The color of the text corresponds to the pseudocolored antibody staining or GFP signal in this and subsequent figures. GFP is shown in a separate panel (B') in gray scale. Vasa (germ cells). Asterisk (Hub). The scale bar represents 10 µm in this and subsequent figures. (C) E-cadDEFL localizes to the hub-GSC interface. Arrow indicates GSCs with a higher expression level of E-cadDEFL. The localization of E-caddCR4h and E-cadDEFL was monitored by GFP, since both E-caddCR4h and E-cadDEFL contain GFP-tag at their C-termini. (D) GSC number was not affected by expression of E-caddCR4h or E-cadDEFL. Data are reported as mean ± S.D. in this and in subsequent graphs. n>45 testes per data point. (E) Percent of testes containing at least one GFP-positive clone at 2, 8, and 16 days after heatshock. n>60 testes per data point.

