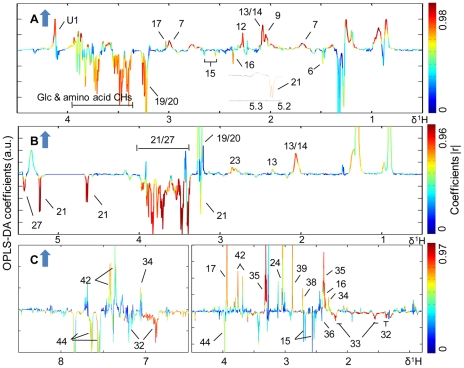
Figure 6. PLS correlation of the NMR spectral data of biofluids and liver tissues with the worm burden.
PLS correlation plot derived from the CPMG filtered 1H NMR data for plasma (R2X = 0.521, Q2 = 0.281) (A), 1H HRMAS NMR data for liver tissue (R2X = 0.541, Q2 = 0.501) (B) and 1H NMR data for urine samples (R2X = 0.455, Q2 = 0.305) (C), which were all obtained from infected mice at week 5 post-infection, against worm burden. The arrows indicated increases in the severity of the infection.

