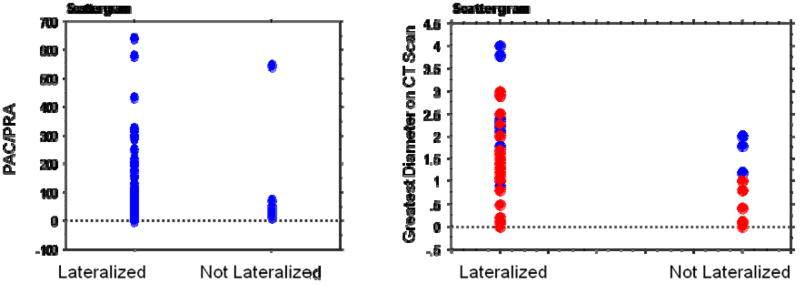
Figure 2.
Scattergram showing the range of values for mean plasma aldosterone concentration-to-plasma renin activity (PAC/PRA) and greatest tumor diameter (cm) of lesion on CT scan versus patients that lateralized or did not lateralize by adrenal venous sampling. Blue and red dots refer to size of lesions on right and left sides, respectively.

