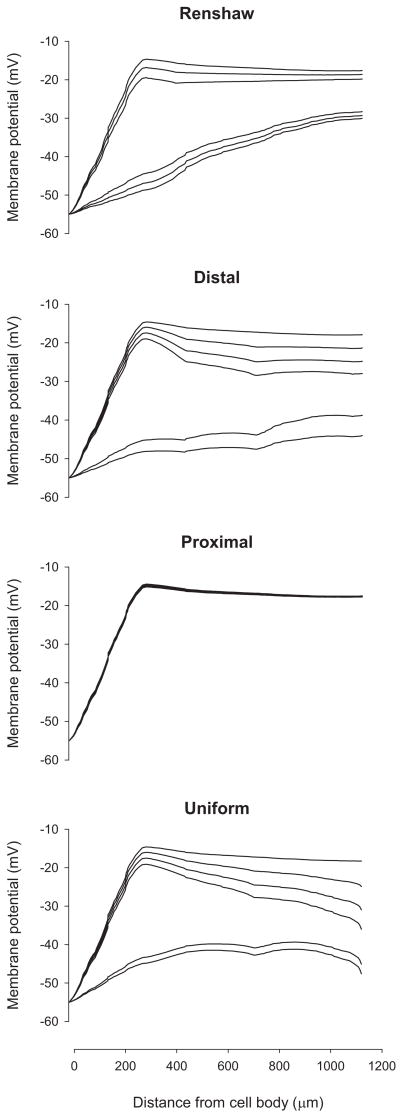
FIG. 3.
Membrane potential profile of a dendritic path from cell body to terminal end of LAD5-4 during different levels of steady-state inhibitory synaptic activity under the 4 different distributions. Rm was set at 5,000 Ω·cm2. The cell body was clamped at −55 mV and excitatory synaptic inputs were activated at 50 Hz. For each set of membrane potential profiles corresponding to a particular distribution of inhibitory synaptic activity, the profiles from top to bottom depict the responses to steady-state inhibition at frequencies of 0, 10, 20, 30, 40, and 50 Hz, respectively.

