
Fig 2.
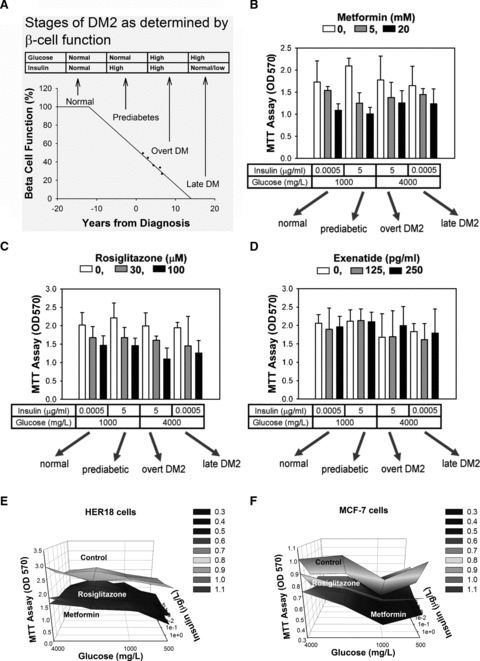
Rosiglitazone and metformin suppress proliferation of cancer cells. (A) The stages in the natural history of DM2 are determined by the loss of β cell function over time. The characteristics of glucose and insulin levels are listed in the table above the diagram, which has been redrawn based on data from the UK Prospective Diabetes Study 16 [26]. MiaPaCa2 cells were cultured for 3 days in media containing different concentrations of glucose and insulin, and were treated with different concentrations of metformin (B), rosiglitazone (C) and exenatide (D). The OD values in the MTT assay are plotted in the bar charts. The drug concentrations are as labelled by the grey-scale key. The glucose and insulin concentrations and the stages of DM2 that they represent are as labelled beneath the bar charts. Error bars represent 95% confidence intervals. The 3D surface demonstrated that the inhibitory effect of rosiglitazone (100 μM) and metformin (20 mM) in HER18 (E) and MCF7 (F) cells was present at all the insulin and glucose concentrations tested. Beginning with the same number of cells, the number of live cells were examined by the MTT assay after culturing for 3 days in DMEM without glucose + 1% FBS with glucose and insulin added at various concentrations.