
Fig 3.
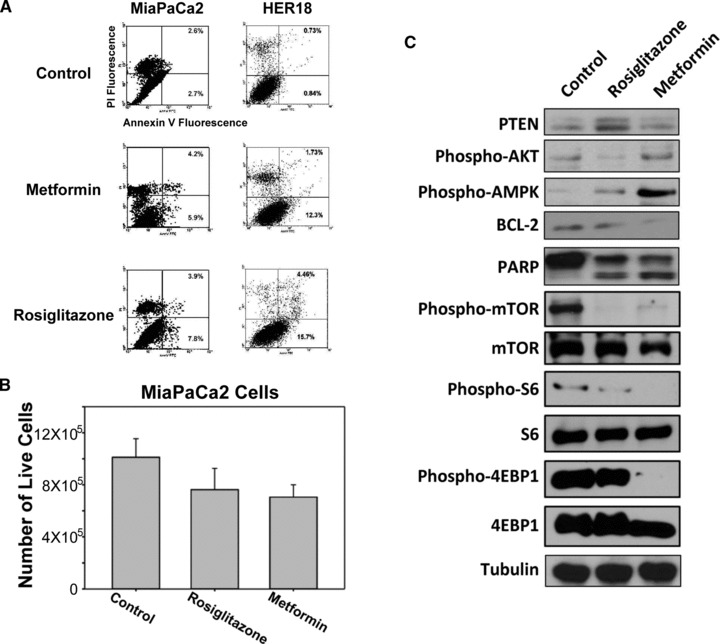
Metformin and rosiglitazone induce apoptosis in cancer cells. (A) MiaPaCa2 and HER18 cells were treated with or without the indicated drugs followed by FACS analysis. The vertical axis represents fluorescence due to PI, and the horizontal axis represents fluorescence due to FITC-annexin V binding. The two right quadrants indicate the percentage of apoptotic cells. (B) MiaPaCa2 cells were treated with metformin and rosiglitazone for 24 hrs. The numbers of live (dye-excluding) cells were counted using a haemocytometer after Trypan blue staining. The error bars represent 95% confidence intervals. (C) Immunoblots of MiaPaCa2 cell lysates after control, metformin and rosiglitazone treatments were shown. The antigens detected were labelled as indicated. Tubulin served as gel loading control.