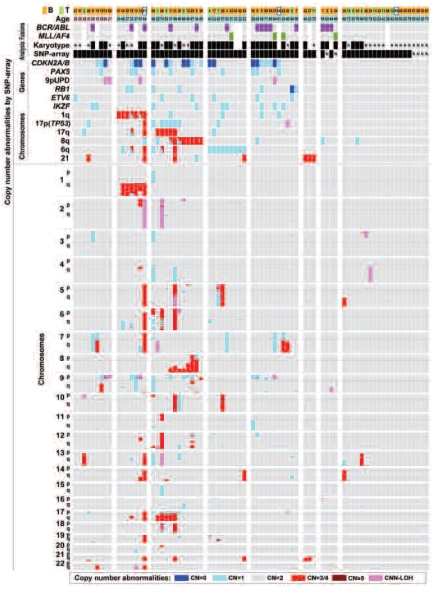
Figure 1.
Summary of SNP array analysis of adult ALL. Seventy-five adult ALL samples were subjected to SNP-array analysis. The groups were separated by types of genomic abnormalities. Orange, B-cell type ALL; light green, T-cell type ALL; white, null-ALL, (cases #B-59, −60, −61); purple, BCR-ABL positive; yellow green, MLL/AF4 positive. Black box = abnormalities detected in the sample; N = no abnormalities detected in the sample. Gray = normal copy number; red = duplication; blue = heterozygous deletion; dark blue = homozygous deletion; pink = CNN-LOH; p = short arm; q = long arm; CN = copy number; 0 = 0 N (homozygous deletion); 1 = 1 N (heterozygous deletion); 2 = 2 N (normal); ¾ = 3 or 4 N (duplication); ≥5 = ≥5 N (amplification); CNN-LOH = copy number neutral loss-of-heterozygosi-ty. The groups were separated based on abnormalities and age: group 1, adolescent group (19–21 years old); group 2, 1q duplication; group 3, either 17p deletion or 17q duplication or 8q duplication; group 4, 6q deletion; group 5, one or more deletions of CDKN2A/B, PAX5, 9pUPD, RB1, ETV6 and IKZF; group 6, chromosome 21 duplication; group 7, either BCR/ABL or MLL/AF4; group 8, other than above.

