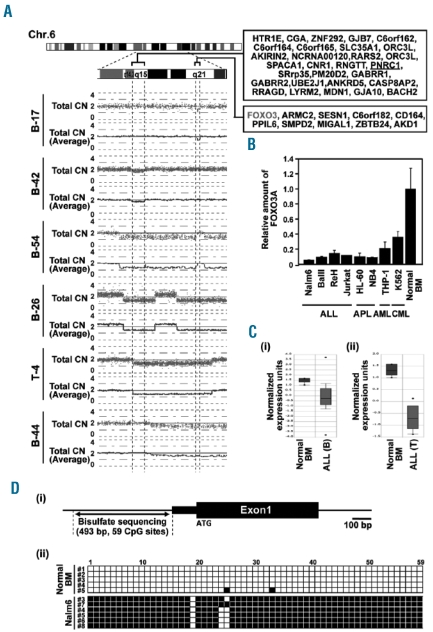
Figure 2.
Identification of target genes by determination of commonly affected genomic regions with the CNAG (Copy Number Analyser for GeneChip®) software. (A) Deletions on chromosome 6q of a collection of adult ALL samples: candidate genes are listed on the right side of the figure. While many samples harbor large deletions containing hundreds of potential target genes of the genomic lesion, overlapping the data from other samples leads to a reduction of size of the common region. This is impressively shown here in adult ALL for heterozygous deletions pointing to the candidate region as q15 containing the FOXO3 gene, which was also involved in a breakpoint in case #B-17. (B) Expression levels of FOXO3 in various cell lines. FOXO3 expression levels were measured in ALL as well as APL, AML and CML cell lines by real-time PCR and compared with expression in normal bone marrow. (C) FOXO3 expression profiling by microarray in childhood acute leukemia by Oncomine. Gene expression analyses were performed on (i) 87 samples of B-ALL and (ii) 11 samples of T-ALL of the Andersson_Leukemia study (http://www.ncbi.nlm.nih.gov/geo/query/acc.cgi?acc=GSE7186). FOXO3 expression was lower in both B-ALL and T-ALL samples than in normal bone marrow (P= 1.6×10⁻¹¹ and 1.2×10−08, respectively). ALL(B) = B-cell type acute lymphoblastic leukemia; ALL (T) = T-cell type acute lymphoblastic leukemia; BM = bone marrow. (D) Methylation analysis of the FOXO3 promoter region (i) A scheme of the FOXO3 promoter region. (ii) Results of bisulfate sequencing are shown. At least five colonies were examined. White box = non-methylated CpG; Black box = methylated CpG.

