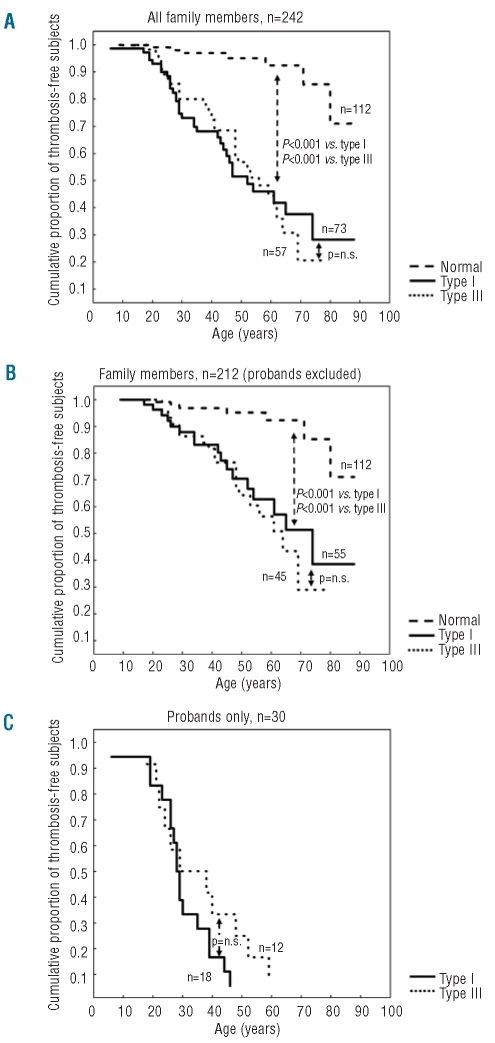
Figure 1.
Thrombosis-free survival analysis of PS-deficient individuals. Kaplan-Meier analysis of (A) the whole study cohort (probands and family members); (B) family members after exclusion of probands; and (C) probands only. The dashed lines represent normal individuals, solid and dotted lines represent type I and type III PS-deficient individuals, respectively. Differences between the curves were evaluated with the log-rank test.

