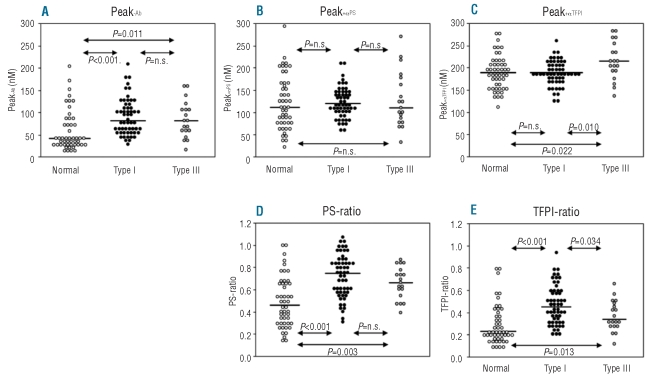
Figure 4.
Thrombin generation in the absence and presence of αPS or αTFPI. Thrombin generation was measured at 1.36 pM tissue factor in the absence and presence of antibodies against PS or TFPI. FV Leiden carriers were excluded. (A) Thrombin peaks measured in the absence of antibodies; (B) thrombin peaks measured in the presence of αPS; (C) thrombin peaks measured in the presence of αTFPI; (D) PS-ratio; (E) TFPI-ratio. White circles, normal individuals; black circles, individuals with type I PS deficiency; gray circles, individuals with type III PS deficiency. Lines represent the medians of the respective distributions. P values of the Mann-Whitney-Wilcoxon U test are indicated.

