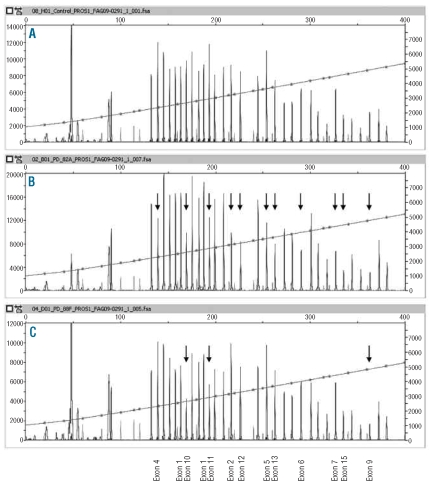
Figure 5.
Detection of gross PROS1 deletions by MLPA analysis. MLPA electropherograms obtained in a normal control (A) and in two unrelated PS-deficient individuals with a partial PROS1 deletion (B, C). The peaks corresponding to PROS1 exons are labeled at the bottom. The unlabeled peaks correspond to control gene regions. A marked reduction of the height of a PROS1 -specific peak (arrows) relative to the control gene peaks indicates a deletion of one copy of that particular PROS1 exon. The small peaks represent the size standard.

