Figure 3.
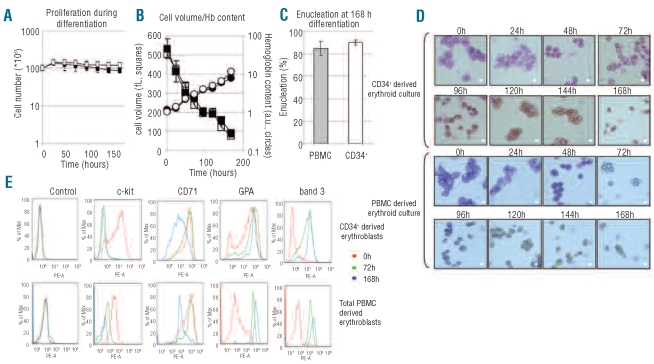
Differentiation of erythroblasts derived from total PBMC or CD34+ cells is comparable. (A) Proliferation and cell cycle arrest during differentiation of erythroblasts from 1x10⁸ total PBMC (black squares) or 0.2x10⁶ CD34+ cells purified from 1x10⁸ total PBMC (white squares). Cell number in millions plotted against time (h). See Design and Methods for differentiation conditions. (B) Hemoglobinization and cell volume loss during differentiation of erythroblasts expanded from total PBMC (black squares; black circles) or CD34+ cells (white squares; white circles) during erythroblast differentiation (three independent measurements). (C) Comparison of enucleation rates after 168 h differentiation between erythroblasts cultured from total PBMC or CD34+ cells. Error bars indicate SD from at least three independent experiments, counting 125 cells at 168 h in differentiation per cytospin. (D) Cell morphology during erythroblast differentiation is similar between total PBMC and CD34+ derived erythroblasts. At indicated times, aliquots of cell culture were taken, cytospinned and stained with a benzidine/Giemsa stain (see Design and Methods). Scale bars = 9 μm. (E) Cell surface expression of specific erythroid markers over time. Cell surface expression of c-kit, CD71, GPA and band 3 checked on expanding erythroblasts (0 h, red), after 72 h of differentiation (green) and after 168 h of differentiation (blue) for CD34+ derived erythroblasts (top panels) and for erythroblasts derived from total PBMC (bottom panels). Figures representative of three independent experiments.

