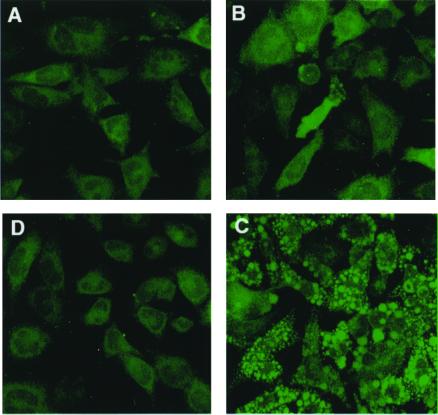
Figure 1.
Representative images of fluorescent signals generated from composite images obtained by confocal microscopy of AL cells pretreated with the fluorescent probe CM-H2DCFDA for 40 min with or without subsequent arsenite treatment. (A) AL cells treated with only the fluorescent probe; (B) five minutes after the addition of sodium arsenite at a dose of 1 μg/ml (7.7 μM); (C) five minutes after treatment with 2 μg/ml (15.4 μM) sodium arsenite; (D) treatment as in C, but with concurrent 0.1% DMSO.

