Figure 1.
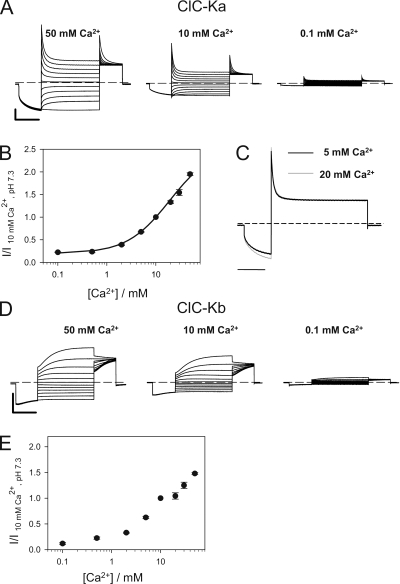
Ca2+ext dependence of ClC-Ka and ClC-Kb. (A) Typical currents of ClC-Ka evoked by the standard IV-pulse protocol at different Ca2+ concentrations as indicated, at pH 7.3. (B) Effect of [Ca2+]ext on ClC-Ka (circles; n = 9). Current at 60 mV acquired at different conditions was normalized to values measured in standard solution (I/I10 mM Ca2+, pH 7.3) and plotted versus [Ca2+]ext (used concentrations: 0.1, 0.5, 2, 5, 10, 20, 30, and 50 mM). The line represents the fit obtained using Eq. 2 as described in Results. (C) Superimposed traces measured at 60 mV at 5 mM [Ca2+]ext (black line) and at 20 mM [Ca2+]ext (gray line) measured from the same oocyte. Currents were scaled to the steady-state current at 60 mV. Horizontal bar, 200 ms. (D) Typical currents of ClC-Kb measured at different Ca2+ concentrations as indicated. (E) Effect of [Ca2+]ext (concentrations as in B) on ClC-Kb (squares; n = 5). Horizontal bars, 200 ms. Vertical bars, 5 µA.

