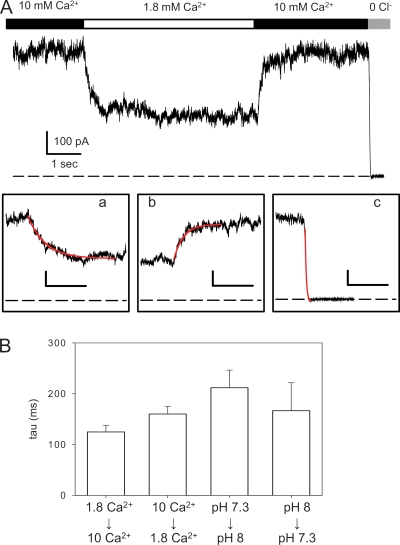
Figure 3.
Relaxation kinetics upon fast concentration jumps in outside-out patches. (A) Example recording of a patch held at 60 mV in which [Ca2+]ext was switched from 10 to 1.8 mM, and then back to 10 mM. Finally, the patch was exposed to a solution without Cl− (and without Ca2+). The three insets below show the transition regions on an expanded time scale (bar, 500 ms), superimposed with a single-exponential fit (red line). Time constants for the solution exchange (inset c) were on the order of 10 ms. (B) Average time constants (n > 3 patches) for the indicated transitions.

