Figure 5.
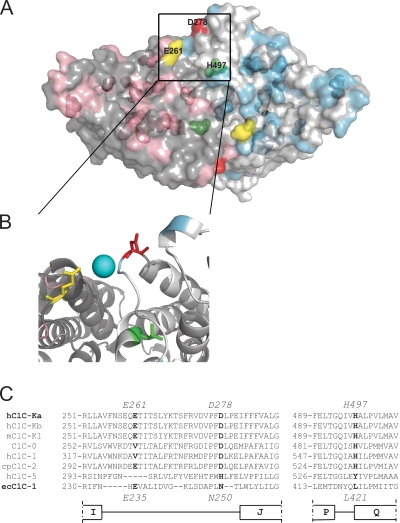
Location of mutants mapped on the structure of ecClC-1. (A) A surface representation of the bacterial ecClC-1 (Protein Databank accession no. 1OTS) viewed from the extracellular side is shown. The two subunits that compose ecClC-1 are colored in gray and light gray, respectively. The residues corresponding to those selected for mutation are shown in pink and light blue in the two different subunits, respectively. The transparent surface also allows a glimpse of the internal mutated residues. The residues responsible for Ca2+ and H+ sensitivity are shown in different colors: yellow, E261 (corresponding to E235 of ecClC-1); red, D278 (corresponding to N250 of ecClC-1); green, H497 (corresponding to L421 of ecClC-1); the numbers of residues indicated in the figure correspond to those of ClC-Ka. (B) A zoom of a selected region is shown in cartoon representation. The three residues E235, N250, and L421 are highlighted as sticks and colored as in A. A hypothetical Ca2+ ion is shown as a light blue sphere between E261 and D278. (C) Alignments around the three residues responsible for Ca2+ and proton sensitivity are shown. E261, D278, H497, and the corresponding residues in other CLCs are in bold.

